
A Euclid primer
The mission
ESA’s Euclid mission is designed to explore the composition and evolution of the dark Universe. The space telescope will create a great map of the large-scale structure of the Universe across space and time by observing billions of galaxies out to 10 billion light-years, across more than a third of the sky. Euclid will explore how the Universe has expanded and how structure has formed over cosmic history, revealing more about the role of gravity and the nature of dark energy and dark matter.
—ESA
|
|
|
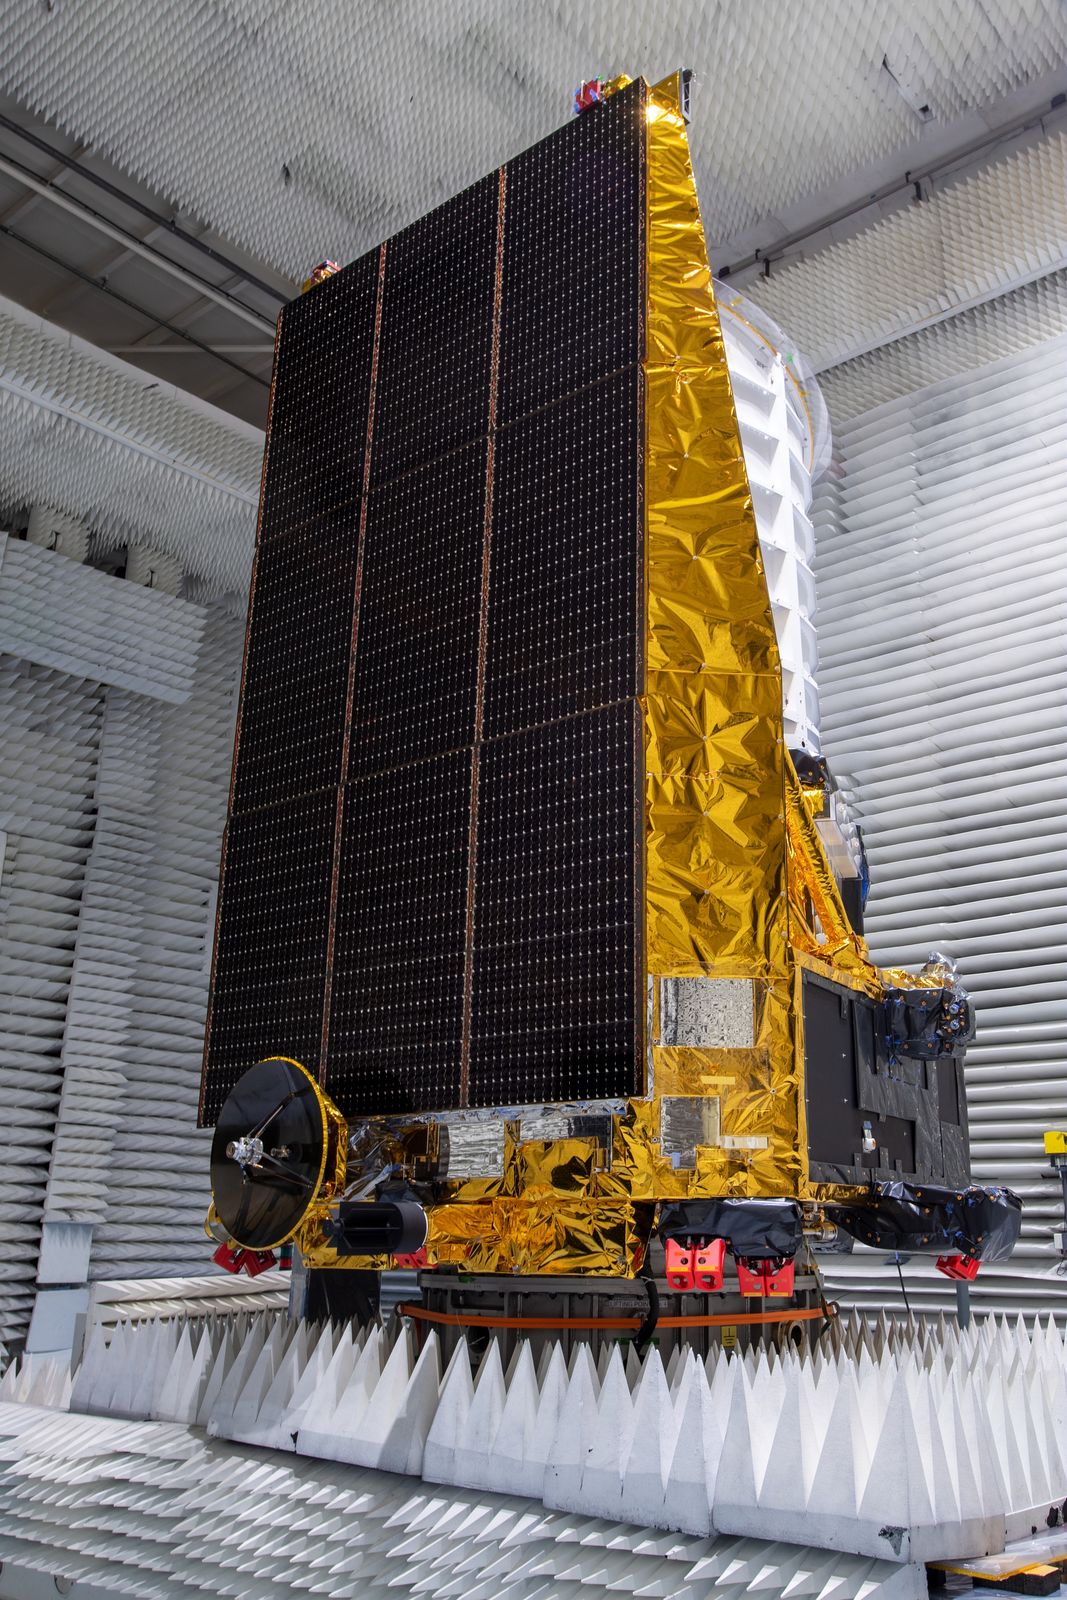
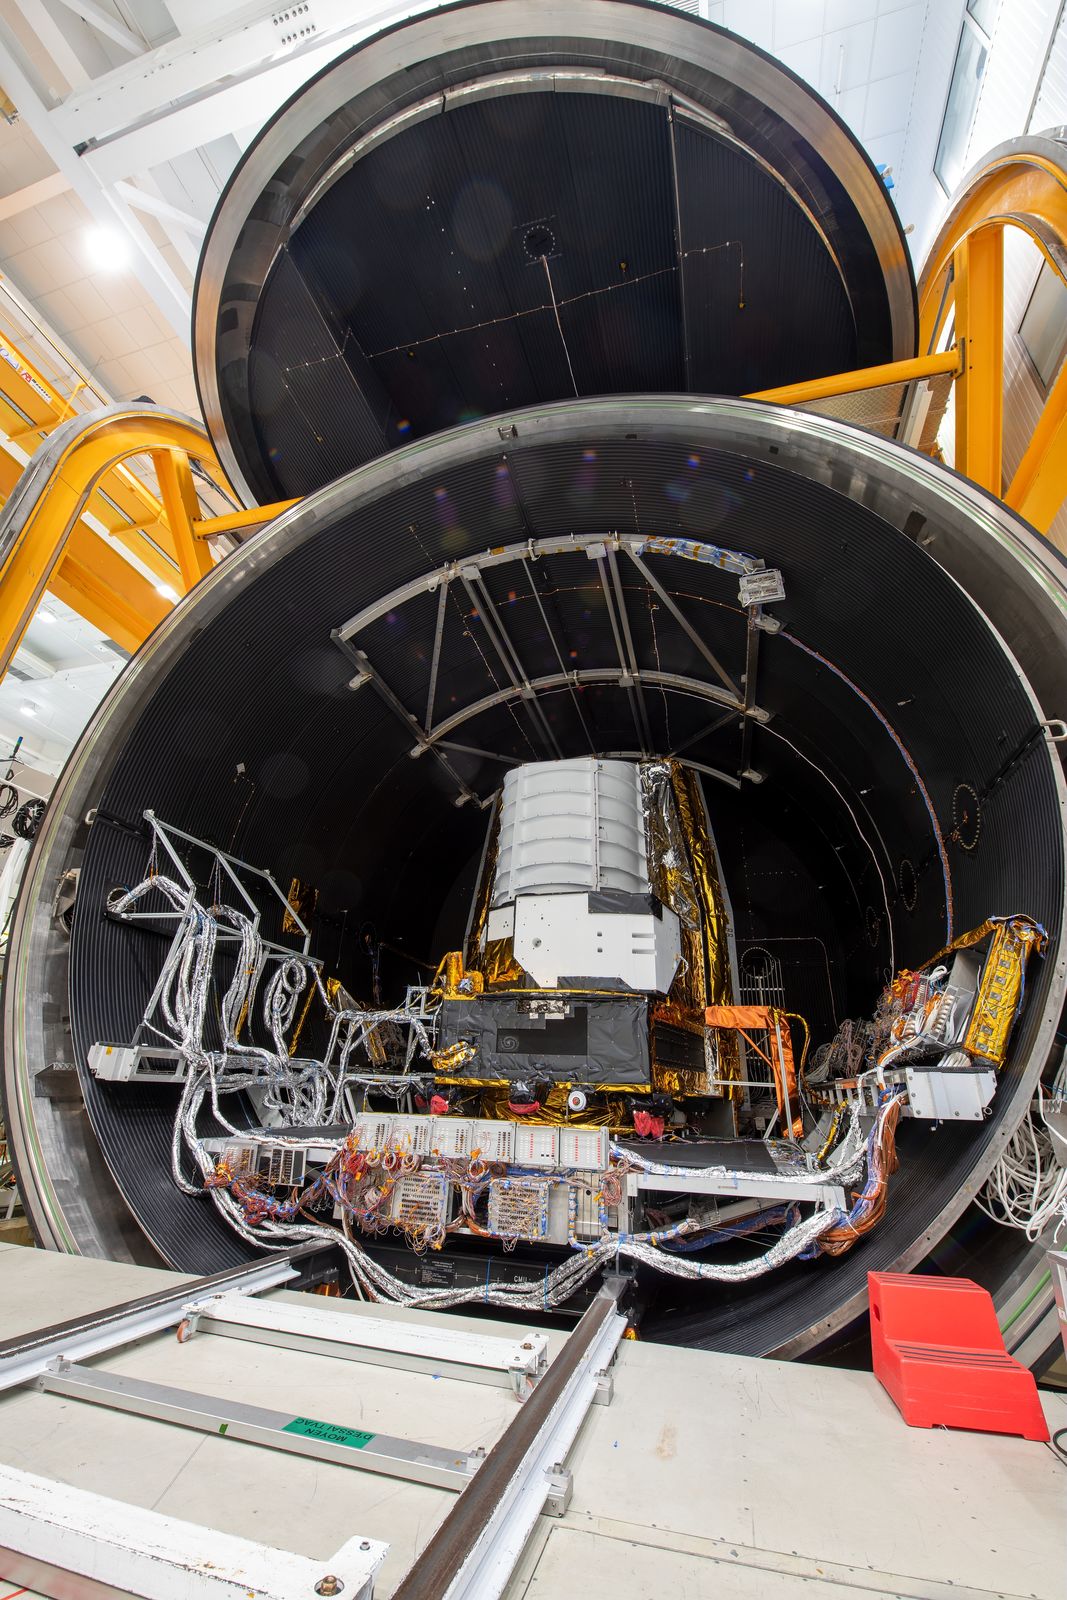
Euclid testing at Thales Alenia Space, Cannes, France. (credit: ESA / M. Pédoussaut) |
||
The instruments
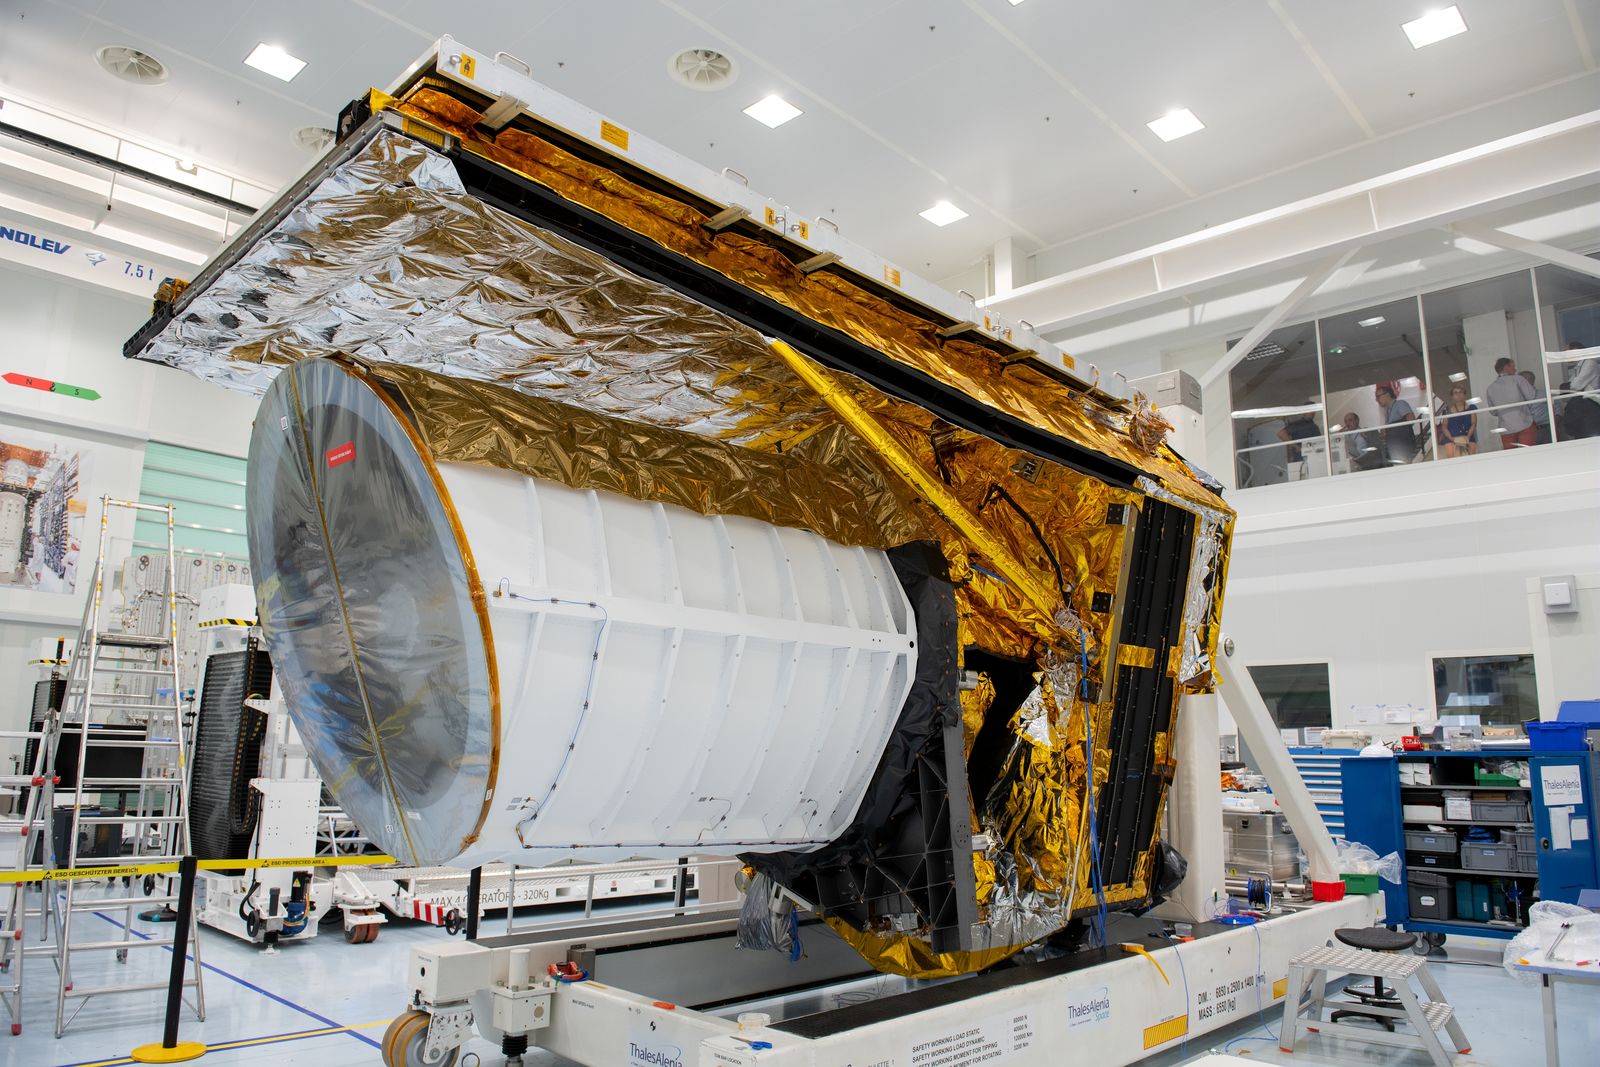
In order to create a “great map of the Universe”, Euclid takes a lot of pictures with two instruments: VIS and NISP. VIS is a camera sensitive to visible light and outputs a single “color”, or band, named I – which covers all the shades of the rainbow, like a consumer black-and-white camera would do. NISP is the instrument pictured on the right during integration tests at LAM, Marseille, France (credit: Euclid Consortium). This is a “near-infrared spectro-photometer”, a term we will not decipher here because we will only consider the photometer half of it, NIP. NIP uses color filters to capture three different bands named Y, J and H, all of which are in the infrared.
To sum up, only VIS captures colors which could be visible to the human eye, but outputs black-and-white pixels, while NISP data covers three bands which would all appear black to us! The reason is that most galaxies which Euclid unveils would be barely visible, and could not be studied, with traditional colors. Azulero uses all IYJH bands to produce “false-color” images, as do most telescope projects, including Hubble and James Webb space telescopes.
The Science Ground Segment
The Science Ground Segment (SGS) is the set of hardware and software components used to extract scientific results from the sequence of zeros and ones of the telemetry data. The scientific software is split into Processing Functions (PFs), each with its own responsibilities. Here is an outrageously simplified view of the data flow between PFs in the SGS:
We have outlined in red the part of the data flow which goes from the telemetry to the data used by Azulero: MER mosaics. LE1 is responsible for converting telemetry data into raw images. VIS and NIR respectively process the raw images from VIS and NIP instruments to obtain calibrated images. In these images, defects are identified or corrected and fluxes are estimated, i.e. the amount of light which hits a pixel is known very precisely. Among others, MER is in charge of aligning VIS and NIR images (and SIR images, and detecting galaxies, and creating a catalog…), which results in the data we need!
The MER data
Azulero relies on SGS products named DpdMerBksMosaics, or mosaics in short. In general, within Azulero documentation, we call them simply MER data, because mosaic may be confusing when we also talk about collages.
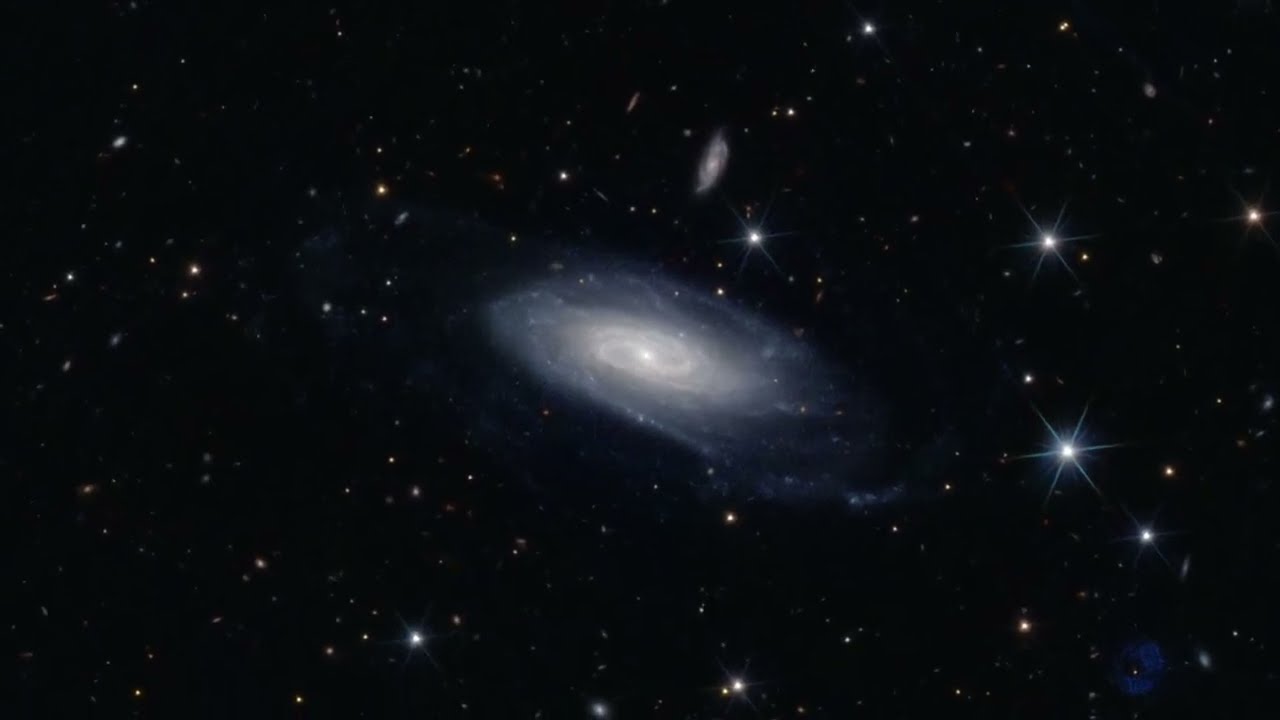
The atomic MER data footprint (the region of the sky it covers) is a tile and all MER products over a tile (images, masks, catalogs) are properly aligned. Tiles are assigned a unique tile index, a term you will encounter often in the documentation (click on the image on the right to visit one such tile).
There are two main types of tiles: DEEP and WIDE. DEEP tiles are quite small (17’ x 17’ in the sky and roughly 10k x 10k pixels in images) but covered by several Euclid observations of the same region. Images from the said observations are aggregated by MER. Aggregation, or stacking, makes fainter objects visible and lowers the noise level. WIDE tiles are comparatively larger (32’ x 32’, 20k x 20k pixels) and not stacked – but azul process will happily stack MER data in WIDE tiles observed several times.